


Everyone can see the dots. Connect them and present the bigger picture.
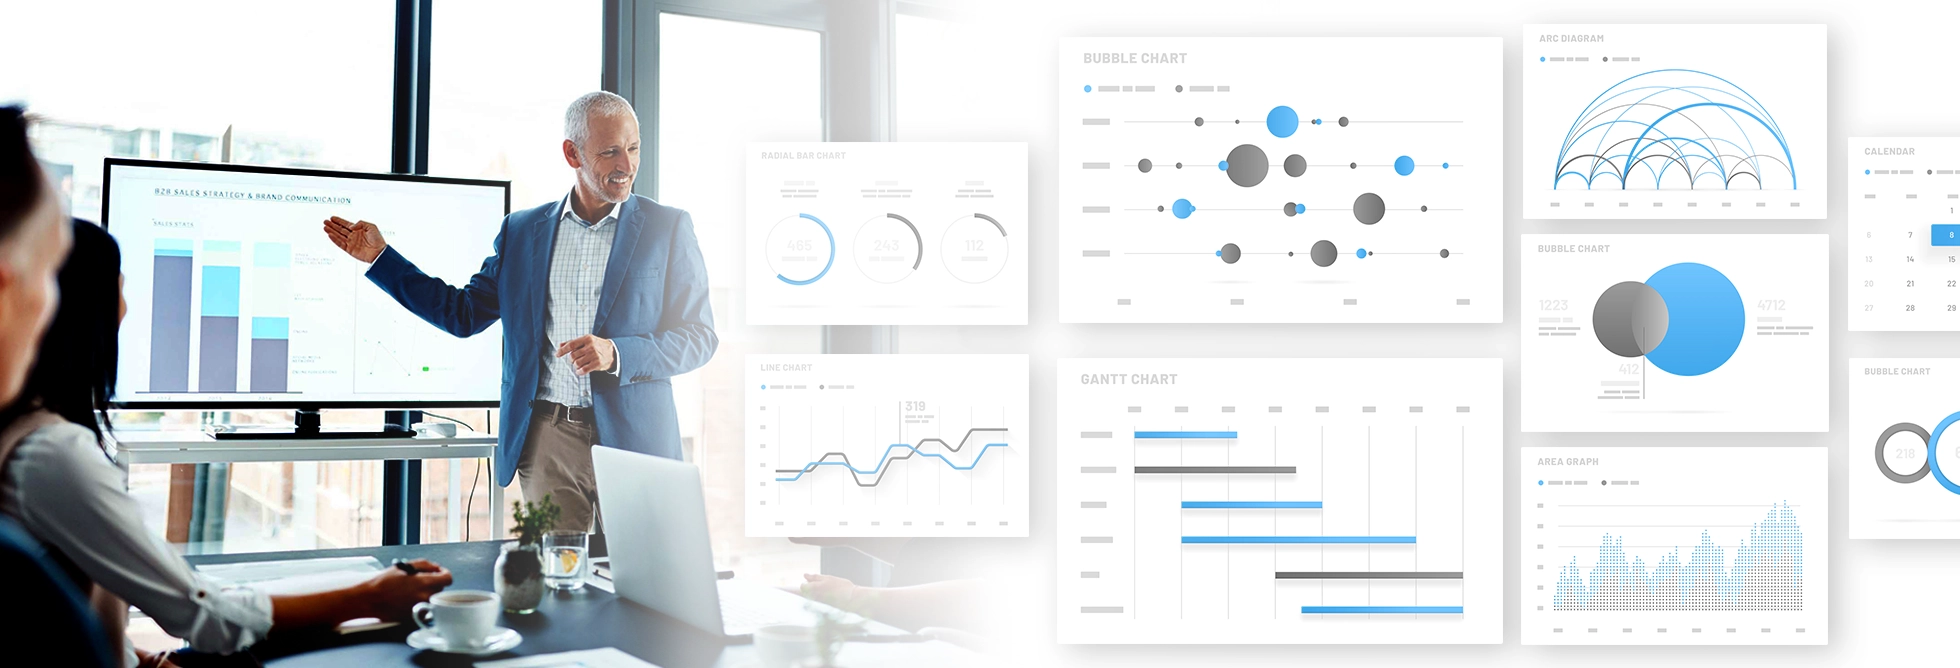

DATA VISUALIZATION TRAININGTO TURN DATA INTO ACTION
Turn Analytics Into Actionable Insights With Training That Combines Visuals, Strategy & Influence


Trusted by the world’s best
Training in all 50 states and around the world.


MASTER DATA VISUALIZATION TRAINING TO INFLUENCE DECISIONS
Lead With Insight Through A Storytelling With Data Workshop Designed For Teams And Professionals
Too many data presentations fall flat—not because the numbers are wrong, but because the story is missing. Whether you're an individual professional or a business leader, you've likely experienced the frustration of insights being ignored, reports getting buried, or audiences tuning out midway through the slide deck.
Moxie’s data visualization training and data storytelling workshops are built to change that. You'll learn how to explain complex information clearly, connect insights to real-world outcomes, and create visuals that make data not just understandable—but unforgettable.
With proven methods trusted by global companies and professionals alike, Moxie helps you make data memorable, persuasive, and presentation-ready—whether you're leading a team meeting or briefing stakeholders.
LED BY EXPERTS
With 10+ Years Of Experience
CUSTOMIZED
Specifically For Your Needs
VISUAL POWER
Make Your Data Stand Out
ENGAGEMENT
Keep Stakeholders Tuned In

DATA VISUALIZATION TRAINING TOPICS TO DRIVE REAL IMPACT
Master The Tools, Techniques, And Mindsets Behind Data Storytelling That Connects And Converts

STRATEGIC DATA SYNTHESIS
- Learn advanced techniques to distill complex datasets into clear observations
- Identify meaningful patterns that others miss
- Transform raw numbers into actionable business intelligence

INSIGHT-DRIVEN RECOMMENDATIONS
- Develop frameworks for crafting compelling recommendations based on data
- Bridge the gap between analysis and strategic business decisions
- Create evidence-based proposals that drive organizational action

VISUAL CLARITY OPTIMIZATION
- Deconstruct cluttered data presentations into focused, impactful slides
- Apply information hierarchy principles to guide viewer attention
- Eliminate visual noise that obscures critical insights

ANNOTATION MASTERY
- Strategically overlay explanatory elements that amplify key data points
- Create visual cues that guide audience understanding
- Develop a consistent system for highlighting critical information

CHART SELECTION & DESIGN
- Choose the optimal visualization format for different data types
- Apply data storytelling training principles to enhance comprehension
- Design visualizations that communicate at both detailed and summary levels
WHY DATA STORYTELLING WORKSHOPS CREATE BUSINESS IMPACT
Empower Teams And Leaders To Present With Purpose, Influence, And Clarity
TRANSLATE INFORMATION INTO INSIGHT
WIN OVER YOUR DECISION-MAKERS
MAKE IT 10x MORE CLEAR
GET CUSTOMERS ON YOUR SIDE
FROM DATA TO “LET’S DO IT”
MAKE IT EASY ON THE EYES
FIND INSIGHTS THAT GIVE CLEAR DIRECTION
CHARGE YOUR PRESENTATIONS WITH PERSUASION
DELIVER DATA THAT CREATES ACTION


OTHER WAYS TO EXPERIENCE DATA VISUALIZATION TRAINING
Choose From Flexible Formats That Fit Your Team’s Needs And Learning Preferences
DATA STORYTELLING TRAINING FOR PEOPLE WHO PRESENT DATA THAT MATTERS
Whether You Lead, Analyze, Or Present—We Help You Make Data Make Sense
Executives
Professionals
Driven Teams
Entrepreneurs

Lead
Guide Strategy With Insight
Decide
Use Data To Drive Action
Influence
Present Ideas With Clarity
See what our clients say

"HOME RUN"

Director of Content Operations, Netflix
Tracy Wright
“Everyone really enjoyed the session and I have heard them reference it in multiple ways over the past few months since…” Read More about Tracy Wright
"WE LOVE MOXIE!"

Executive Communications, Lockheed Martin Space
Tracy Weise
“I received many thank you’s and compliments on Moxie. They were wonderful and everyone loved them…” Read More about Tracy Weise
"INSPIRE OUR CREATIVITY"

Senior Trade Strategy Manager, Anheiser Busch
Emily Sullivan
“This was a great class that gave me the ability to apply what we were learning in real time. The tips on graph visualization were especially…” Read More about Emily Sullivan
"WANT TO DO THIS AGAIN"

Universal Hospital Services, VP Communication and Investor Relations
Kate Kaiser
“We cannot thank Moxie’s media training enough for their EXPERT coaching and encouragement. We got such a kick out of working…” Read More about Kate Kaiser
Item 1 of 4

DATA STORYTELLING TRAINING RESULTS THAT SPEAK FOR THEMSELVES

0
APPLYING SKILLS IMMEDIATELY
0
EXCEPTIONAL EDUCATORS
0
ACTIONABLE & EFFECTIVE MATERIAL

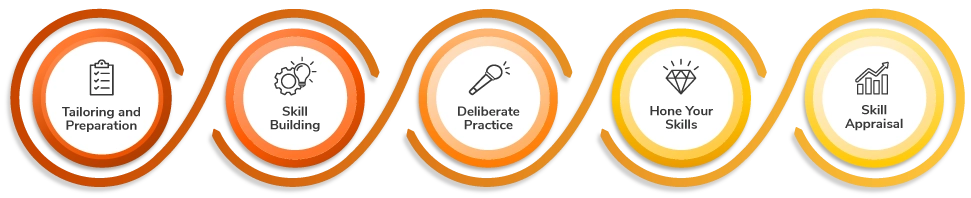
HOW OUR DATA STORYTELLING TRAINING DELIVERS LASTING RESULTS
From Kickoff To Final Presentation, We Guide You Every Step Of The Way
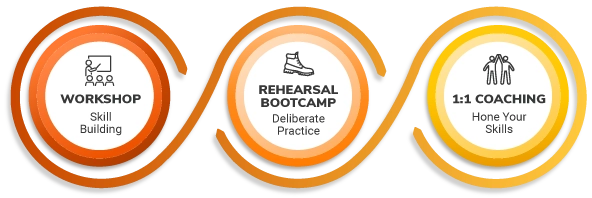
Whether you’re getting team training or individual coaching, our process ensures continuous refinements that adapt to your industry, learning preferences, and level of skill. Through experiential learning, dedicated practice, and habit-building techniques, we pride ourselves on delivering custom data visualization training solutions that ensure you or your team learn relevant skills and how to apply them effectively.
The Moxie
Training process
Item 1 of 2
MOXIE TRACKS FOR DATA STORYTELLING & BEYOND
Build Enduring Skills Across Leadership, Influence, And Presentation
To truly learn a new skill, you need to practice it, apply it, and ideally, have a Moxie Master Trainer or Coach to give you world-class instruction. Each of our Moxie Tracks include 4 Programs where we continuously refine and tailor our data storytelling training for you every step of the way. Every team and individual has different needs and ways of learning. Our Moxie Tracks provide personalized instruction to accelerate your growth and build skills and habits that will benefit your career.
Presentation Skills
Business Storytelling
Executive Presence Coaching
Confident Speaking Coaching
1
STORY POWER
Structure Your Presentation To Persuade & Inform
2
IMPACT STORYTELLING
Craft Compelling Stories To Move Audiences
3
AUDIENCE ENGAGEMENT
Ensure Audiences Listen, Participate, & Care
4
SPEAK WITH MOXIE
Deliver Your Message With Confidence & Credibility
OUR MOXIE MODEL©
The Not-So-Secret To Your Success
The Moxie Model© is embedded into every training and coaching experience we deliver. It’s how professionals and teams learn to communicate with clarity, confidence, and influence—across presentations, meetings, and high-stakes leadership moments. Rather than teaching surface-level techniques, our model builds the core communication skills leaders need to drive alignment, inspire action, and perform consistently in real business environments.
NEUROSCIENCE
Did you know that speaking with passion causes neurons in your audience’s brains to mimic your enthusiasm? All our training is informed by proven studies that reveal how the mind works and the techniques you can use to communicate effectively.
ADULT LEARNING THEORY
No one learns through lectures. Insights must be applied for them to be remembered. Skills must be practiced for new habits to form. Our coaching and training is experiential and tailored to ensure maximum retention and skill building.
PERFORMING ARTS
An actor on a stage, with no microphone, can speak with such gravitas, power, and charisma that any audience will sit and listen, enraptured. We teach you how to communicate this way. So that your voice can command respect and be heard.
WHAT MAKES OUR DATA VISUALIZATION TRAINING STAND OUT
1
TRAIN WITH YOUR REAL DATASETS
Moxie’s experiential training will help you master data storytelling and visualization with real experience. Storytelling training will help you realize the benefits of both narrative structures and data visualization and implement them. No matter what data you have, you’ll be able to bring it to life.
2
HARNESS THE NEUROSCIENCE OF DATA STORYTELLING
Moxie’s data storytelling workshops train you on how to tell a story with data. Tie your data into a narrative structure that leads to clarity and action! Learn proven methods, backed by neuroscience to present with impact and ensure your insights are remembered.
3
LEARN THE BEST METHODS FROM THE BEST TRAINERS
The success of Moxie clients is no accident—you become the best at data storytelling and visualization when you’re trained by the best. Our data storytelling workshop is taught by top-tier experts who will give you a lifetime of data-driven skills that will help you stay in the lead.
Take the first step today
Have questions? We can help!
Frequently asked questions
What Is Moxie’s Data Visualization Training?
Who Is Moxie’s Data Storytelling Training Best For?
How Is Moxie’s Data Visualization Training Different?
What Results Can We Expect From Moxie’s Data Storytelling Workshop?
How Is Moxie’s Data Visualization Training Delivered?
How Long Does Moxie’s Data Storytelling Training Take To See Results?
Can Moxie’s Data Visualization Training Be Customized To Our Tools And Use Cases?
How Do We Get Started With Moxie’s Data Storytelling Training?
did you know?
STORY-DRIVEN DATA PRESENTATIONS BOOST BRAIN ENGAGEMENT BY 60%
A study published in Frontiers in Human Neuroscience reveals that narratives following a dramatic arc significantly increase neural engagement, particularly in the latter phases of the story. This heightened engagement correlates with improved memory retention and decision-making. By structuring data presentations as compelling narratives, professionals can activate these neural pathways, making their insights more memorable and persuasive. Moxie’s data visualization training equips you with the skills to transform raw data into impactful stories, ensuring your message resonates and drives action.

OUR EXPERT RESOURCES FOR DATA VISUALIZATION TRAINING
Read On For Proven Tips To Make Data Clear, Visual, And Actionable


Item 1 of 6

DATA STORYTELLING TRAINING BACKED BY SCIENCE AND STRATEGY
Moxie’s data visualization training is built for professionals and teams who need more than charts and dashboards—they need to drive decisions. Our signature methodology combines storytelling frameworks, neuroscience, and performing arts techniques to transform how you present data. With deep experience coaching everyone from analysts to C-suite leaders, our expert trainers know how to tailor content that makes insights resonate. This isn’t one-size-fits-all training—it’s a proven path to presenting complex information with confidence, clarity, and influence. Whether you're leading meetings or pitching big ideas, Moxie’s storytelling with data training helps you turn numbers into momentum.
Learn More About Us